debugging

Drupal Debugging

Debugging Drupal is not that much different from any kind of debugging or problem-solving, and the topics we'll cover are the same regardless of your level of Drupal or PHP expertise.

Here we'll cover three topics:

  1. Strategy: How do we think about the problem? How do we gather basic information about the problem? How do we not get stuck debugging the wrong problem?
  2. Tools: What tools can be bring to bear on our problem? What should we have prepared in advance?
  3. Techniques: What specific techniques can we use?

Although you may be here for #3, the first two will probably have more of an impact on your success, so we're going to spend some good time on them first.

Topics: 

Debugging Strategies

Turn on your brain first

Before beginning a debugging effort, turn on your brain. Ask yourself some questions:

  • Have you looked at the Drupal log yet? Going to admin->reports->dblog has solved many a problem... after I've spent an hour trying to figure it out.
  • Have you looked at the Apache log yet? If you're debugging a WSOD (White Screen of Death) and haven't looked at the Apache log yet, you're wasting your time. If you don't yet know where the apache log is on sites you maintain, find out now.
  • Has anything changed on the site lately?
  • Is your internet connection working?
  • Are other sites on the same server working correctly?
  • Does the dev or staging version of your site still work?

Divide and Conquer: Binary Search

Almost any piece of software or any debugging problem is too large to understand all at once. So you have to figure out ways to divide the problem. If you can divide the problem in half a couple of times you'll rapidly have a more understandable problem.

There are many ways to divide up a problem:

  • Divide it into different sections of code
  • Divide it into different modules or different combinations of modules
  • Divide it into different versions (if it appears to be a version-related issue)

Best practices that will make problem-solving easier

Many of the items in this tutorial may require you to learn a new technique or two. Commit to breaking out of the stalemate. Don't let skills that you haven't yet mastered keep you from really resolving a problem. Learn them, even if it means investing in them in the midst of a crisis. Never let a mysterious site remain mysterious. Commit the resources you need to shine the light on your Drupal installation. It's worth it - it will pay off in no time.

  1. Keep a log of changes on the site. Note when a new module is installed, when a patch is applied, when an upgrade is done. You may want to consider using the journal module to help with this.  But a simple log like this one can make problemsolving easier.
  2. Keep your code under source control, and know how to use it.
  3. Keep multiple backups of your database. Use the Backup and Migrate module for small sites, or another backup technique for larger sites.
  4. Make sure you have an environment set up that is similar to your production environment where you can set up a clone of the production site at a moment's notice.
  5. Use a notebook to record changes as you make them when you're working through a lot of experiments, like enabling and disabling modules. Otherwise you may not be able to remember where you came from or how to get back there.


Topics: 

Debugging Tools: Preparation and Investment Ahead of Time

If you invest in your infrastructure ahead of time, life will be so much easier. If you know how to load and dump the database quickly and how to get a file copy of a production database in moments, and you know how to revert to an earlier version of the code, life will be so much better. Learn how to do these things, whether you do "code" or not:

  1. Have an environment where you can run a copy of any production website you're responsible for. This doesn't mean the exact same setup - it may not even need to be the same operating system. But you'll probably want to match PHP major versions and Mysql major versions. If you have PHP 5.2 and Mysql 5 on the production server, you'll probably need an environment that comes close to that. Yes, if your production site runs Linux, you'll probably want to be able to duplicate that. But many problems and issues can be demonstrated successfully on a Windows machine with Xampp or a Mac with Mamp. And most Drupal websites will run fine in many environments.
  2. Learn how to clone your production website in moments. When a crisis time comes for your production website, you need to be able to make a copy of it to work with it. Trying to debug on a live site has enormous disadvantages: Your own conservatism about making changes is one of those, the risk that you'll break something worse is another, and just the fact that it's far away and harder to work with is a third. Working on a cloned website is non-negotiable, in my opinion, and will pay off at least 90% of the time.

    Demonstration: Cloning a website in moments
  3. Keep your site under source control and know how to use it. If your site is under source control, you can roll back any part of it in moments and you can experiment easily with different versions of the code.

    Demonstration: Using source control to debug. (Delete a section. Delete modules. Revert to an earlier time. Move forward in time)
  4. Learn Drush. You'll be happy you did.
  5. Get Step-debugging going if you can work with PHP code. You really can't live without it.

    Demonstration: Step debugging with Eclipse.

Topics: 

Debugging Techniques

Now, for some nitty-gritty techniques.

  • Using Divide-And-Conquer
    • Example: Binary search (of modules) by disabling modules.  (demonstration)
    • Example: Binary search (of history) by going back in time in the code tree (demonstration)
    • Example: Binary search (of code execution) by step-debugging over significant sections of the site and then zeroing in on the section where the problem occurs.
  • Getting more information: Instrumentation: Many times, you just don't have enough information to understand what a problem consists of, not to mention what's causing it. In this situation you need to instrument the system to coax it to tell you what you need to know.
    • Devel module.
    • Trace module
    • Add your own on-the-fly instrumentation so you get the information you need. To do this sanely you have to be working on a clone of the site you're debugging, and to do it well, it should be under source control, so you can quickly and safely revert your hacks. Most of these are especially valuable in places like hooks, where the code executes thousands of times with no problems, but then displays a disaster on execution 1001. Step-debugging with conditional breakpoints can be used well, but sometimes you just want to find out quickly.  Some quick hacks:
      • Webchick's Quick and Dirty Debugging: Hack drupal_set_message() in bootstrap.inc to get a stack trace, so you can see where the problem comes from. For example, you just see a nasty error about a database issue, but no context: Show the stack trace and you'll suddenly understand.
        Add:
        if ($type == 'error') {
           $message .= '<pre>'. print_r(debug_backtrace(), TRUE) .'</pre>';
        }
        to the top of drupal_set_message() and you'll get a backtrace along with the message. The same exact technique works with watchdog - add to the message in watchdog() in includes/bootstrap.inc.
      • Debugging hook_cron: Hook_cron can be quite mischievous, because it's not intended to provide user output. A misbehaving module can cause it to croak without warning, and weeks later you find that cron hasn't been running and you don't know why. In this case we can add instrumentation right into module_invoke_all() in includes/module.inc:
        Add into the for loop just below $function =
        if ($hook == 'cron') { watchdog('debugging', "CRON: Calling $function"); }
        Every invocation of hook_cron then gets logged into watchdog(). The last one you see is the problem.
      • Debugging the infamous " Cannot use object of type stdClass as array" message:
        Right before the moment of disaster, insert something like:
          if (!is_array($x)) {     print '<pre>' . print_r(debug_backtrace(), TRUE) . '</pre>';  }
      • Debugging Drupal batch operations: This can be the very best technique for figuring out what's going on with batch operations. In fact, the only two ways I know of to get visibility into batch operations are to use a step debugger (Eclipse works wonderfully) or to add watchdog() calls to your code. In order to avoid being overwhelmed by the quantity, try making your watchdog calls conditional on the type of event you're working on.
  • Repetitive testing and refinement where the database is altered: There are a number of situations (mostly upgrade-related) where the activity you're debugging is actually changing the database, so to binary search and zero in on the problem, you have to start over again and again. If this means settings up an entire upgrade environment over and over it can make you tear your hair out. So try this:
    1. Get the test set up (prepare for an upgrade, for example). Get it set right to the point where if you pushed the button your error would be demonstrated.
    2. Dump the database at this point.
    3. Run the test. Use whatever technique you're using to zero in on the error.
    4. Load the dumped database. Rinse and repeat.

Topics: 

Debugging Links and Resources

  • Modules
    • devel module is all about instrumentation. It lets you see database queries and how long they're taking, tells you how long it took to render a page, and a thousand other indispensable things. Not recommended on a live site.
    • trace module will trace hooks and their execution. This is for people who understand what hooks are.
    • drush is not really a module. It allows you to rapidly and easily change the configuration of your system. Need to install devel? drush dl devel; drush enable devel. Sound pretty easy?
    • smtp is the way you test mail sending when you're not on the production site. Many people need it to do mail testing. Install it and point it at your gmail account and you can send mail all you want.  Also check out reroute_email.
  • IDE Debuggers

Topics: 

Tunneling HTTP to Debug or Develop an External Webservice Call

Summary: This post provides a way to develop/debug in a web environment where you don't have control of the calling party and your environment must be available on the global internet.

It can be difficult to debug/develop a handler for an incoming web service when you don't have control of the caller. For example, I was developing a handler for Mandrill's inbound webhooks, where Mandrill calls your site when an email comes in. So in this case

  • The receiving website must be accessible on the internet so that Mandrill can call it.
  • Mandrill alone is hitting the site. I could debug with an imitation POST, but then that wouldn't be the real thing would it?

There are a couple of ways to approach this:

  • Set up a full debugging environment on an internet-connected host (For example, set up a full dev environment possibly with GUI and PHPStorm for example, on an internet host. This is easy enough to do but kind of ugly.
  • Debug with the application on the server but your debugger local using dbgp. This is do-able and an alternate approach to what's described here. It's a bit more awkward, but great for when the issues or problems can't be recreated on your local machine. It probably also requires most of the strategies shown here, but tunneling the debugger connection instead of tunneling the actual HTTP request.
  • Use printf-style debugging, outputting logs of everything that happens. This works, but you have little control and it's really ugly and you don't have enough info about what's going on.

A nicer way with a full local debugger

I use the wonderful PHPStorm IDE with debugger (which they provide free to open-source projects like Drupal and Warmshowers.org!), but this technique should work for any IDE. You do have to already know how to set up your system for debugging.

What you need:

  • A host on the internet. Any machine which is reachable directly on the internet. My instructions will explain how to do it with a linux machine. This really can be any machine, it's going to be used only to proxy a port to your local machine. You could even use a production machine without doing any damage. You do have to have control of the sshd configuration (/etc/ssh/sshd_config or equivalent). And you have to make sure that no firewall is blocking the port you choose to use (my example uses port 8888.)
  • Your local IDE/project set up for debugging with Xdebug. (I'm sure you can do this with any other IDE and with Zend Debugger as well, but I will only show for PHPStorm and xdebug.)


  1. Make sure you can do step-debugging on your local machine. Use the classic technique where you create a debug configuration for your project rather than the new PHPStorm "Listen" button. (I imagine there's a way to do this with the listen button.) Test this by setting a breakpoint and running your project and making sure it stops on the breakpoint. If you don't already know how to do step-debugging, this would be a good time to learn. It's a critical skill for any developer. Resources: (PHPStorm instructions, Drupal.org article, PHPStorm debugging article) (Images of my PHPStorm web application configuration are below.)
  2. On your internet-connected machine, configure sshd to set "GatewayPorts yes". (The default is "no"). This is configured in /etc/ssh/sshd_config on both DebianUbuntu and RHEL/CentOS distributions.). After changing the configuration, restart sshd with "sudo service ssh restart"
  3. Use ssh to create a tunnel which will bring a port on your internet-available machine to your local machine: ssh -R :8888:localhost:80 example.com will bring traffic on port 8888 of the internet-connected "example.com" to port 80 on localhost (where your debugging environment is). Essentially, once you've done this, all traffic hitting http://example.com:8888 will actually land on your local machine on port 80. (This won't work if you're blocking port 8888 on the firewall of your internet-connected host, of course.)
  4. Try accessing your internet-connected machine with a browser to demonstrate that traffic is routed through. With my example, you would now be able to hit http://example.com:8888 and the dev site on you local machine would appear (slowly, perhaps). If you don't have access to your local dev site now using this technique, you aren't ready to continue.
  5. Test debugging by accessing your external site. Start debugging on PHPStorm using the configuration you created earlier. The console will show "Waiting for incoming connection with ide key '15247'". Your IDE key will be different of course. With a breakpoint set, visit your external internet-connected URL like this: htttp://example.com:8888?XDEBUG_SESSION_START=15247- you should see your IDE take control and stop at your breakpoint.
  6. Now configure the external service with the URL it is to hit when some event happens AND with the XDEBUG_SESSION_START query string. I was working with the Mandrill Incoming project, so my inbound URL looked like this: http://example.com:8888/services/rest/mandrill_events?XDEBUG_SESSION_START=15247
  7. Whatever you have to do to cause an event to happen, make it happen. In my case, this meant sending an email via Mandrill which was to be delivered to my web service.
  8. Voila, your debugger opens and lets you step through the web service call.


PHPStorm Server Configuration

PHPStorm Web Application Configuration

PHPStorm "Waiting for connection"

Remote Drupal/PHP Debugging with Xdebug and PHPStorm

Step-debugging is one of the key skills for any developer, and it can be baffling. When you start trying to control a remote webserver with an IDE running on your local workstation though, it gets even more complicated with the network problems. This article will deal directly with Xdebug as the debugging engine on the PHP end and Jetbrains PHPStorm 7.x as the IDE on the workstation side, but these techniques will work for other IDEs like Eclipse or Komodo, and they'll work for the Zend debugging engine as well.

The Basics: How Remote Debugging Works

The first thing that you absolutely must understand is the sequence of events and how they're initiated. If you have xdebug configured in your PHP configuration (I'll show how later), then when PHP starts executing:

  1. If the PHP session is started with a URL like http://example.com/?XDEBUG_SESSION_START=PHPSTORM (or it was earlier, creating a cookie), then Xdebug within the PHP execution will attempt to make a connection to an IDE, which defaults to be at localhost, port 9000. (If it can't make a connection, it just moves on.)
  2. If the IDE is listening, it gives instructions to Xdebug about breakpoints and such.
  3. When a breakpoint is encountered, Xdebug notifies the IDE on this connection.

You'll notice that the remote machine is attempting to make a connection to an IDE that is, in our situation, on another machine. Unfortunately with actual server configurations, there is usually no way that an outgoing TCP connection can get to your local workstation. If it can you can just configure that in your php.ini or xdebug.ini by setting xdebug.remote_host and you won't have to do all the things we're about to do. But for now we're going to assume you're trying to debug a machine that is out on the internet that cannot directly access your workstation.

To make this happen we'll do three things:

  • Configure the remote server for xdebug
  • Tunnel the remote Xdebug connection to our local machine via ssh
  • Configure PHPStorm on the local machine

Remote Server Configuration

On the remote server:

  1. Make sure the php5-xdebug package or its equivalent is installed. On Debian/Ubuntu this is sudo apt-get install php5-xdebug. On RedHat/Fedora/CentOS this may be sudo yum install php53u-pecl-xdebug depending on the repositories and PHP version you are working with.
  2. Configure the PHP ini file for the xdebug extension. Debian/Ubuntu: /etc/php5/conf.d/xdebug.ini or /etc/php5/conf.d/20-xdebug.ini, RedHat/Fedora/Centos: /etc/php.d/xdebug.ini. You'll need: xdebug.remote_enable=1 in there. The default host to connect to is localhost, and that's the way we're going to leave it, since we're going to tunnel/proxy the connection to our local machine. (If you cannot use port 9000 because it's already in play, you'll have to also configure xdebug.remote_port here and on your local IDE. But we're not going to go there right now.)
  3. Restart Apache or whatever webserver you're using. (If you're using php-fpm, restart it instead). Check for errors of course.
  4. Visit the phpinfo of the remote machine with a web browser. On drupal you can just visit /admin/reports/status/php to get the full output. You should see "with Xdebug v2.2.3, Copyright" … in there. If you see it, you can scroll down to the xdebug section and check that the config is as you set it, especially remote_enable and remote_host (which should be localhost).
  5. Check to see that port 9000 is not already in use (especially by php-fpm if you use that). You can do this by making a connection using the venerable telnet tool. telnet localhost 9000 on the remote machine (install it if you don't already have it by installing the telnet package). If you can make a connection to this point, before proxying the port, then things aren't going to work because something else is there on port 9000. You'll need to find out what it is and work around it one way or another. (To find out what process is using it, try lsof | grep 9000. If you don't have lsof, install it.)

(Had you been working on a remote machine that had direct access to your workstation, you could have set xdebug.remote_host to your workstation's hostname or IP address and not have to do the ssh tunneling/proxying that we'll do in the next step.)

Proxying/Tunneling Your Debugger Connection

Now we need to bring port 9000 to our local machine. What we're doing here is putting a "feeler" on the remote host that will listen on port 9000 and bring anything that happens there to our local machine on port 9000.

ssh -R 9000:localhost:9000 some_user_account@www.example.com

You'll need to re-establish this connection any time the tunnel is interrupted due to network connectivity or a remote or local host reboot, etc.

Set Up The Local IDE

On your local machine you need these things:

  1. A matching set of code to what's on the remote machine. This can be a remote mount via sshfs or other techniques or a copy, git checkout, etc. Of course if you have a copy you can get very confused by having the wrong code presented to you at a breakpoint. We'll demonstrate sshfs and git checkout below.
  2. PHPStorm opened to a project with the code which matches the remote machine and with the "Zero Configuration Debugging" button turned on (listening).

So:

  • Mount the remote code to your local machine or check out a copy locally that exactly matches. For example: If you have sshfs configured on your workstation, sshfs some_user_account@www.example.com:/var/www/myproject /tmp/myprojectwould mount the remote code into /tmp/myproject (which you must create ahead of time). If you don't have sshfs yet, google it to figure out how to configure it. It's nice and it's easy. If you want to run a copy, do something like cd /tmp; git clone git://github.com/example/myproject.git to get an identical codebase. If you prefer, PHPStorm has code syncing capabilities that can maintain a copy for you, but I find it cumbersome.
  • Run PHPStorm and choose File->Open Directory (or open an already existing project, of course). Open the directory where your local copy or mount is.
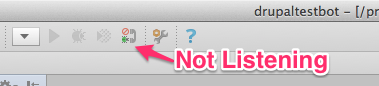
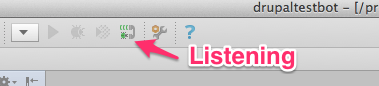
  • Click the "Start Listen for PHP Debug Connections" button on the top toolbar to turn on listening.
  • At this point you should be able to 'telnet localhost 9000' on your local workstation and get a connection. If you click to turn off listening, you should not get a connection. PHPStorm not listening PHPStorm listening
  • On the remote machine the same behavior should now be proxied. telnet localhost 9000 should result in a connection when PHPStorm is listening and the ssh proxy is working, and it should result in no connection when PHPStorm is not listening.

Debug!

If all has gone well,

  1. Set a breakpoint early in your PHP project. For example, in Drupal set a breakpoint on the first line of index.php.
  2. Visit your remote website in the browser with "?XDEBUG_SESSION_START=PHPSTORM" at the end of the URL. For example, http://example.com?XDEBUG_SESSION_START=PHPSTORM. (Note: As far as I can tell, with this configuration it doesn't matter what XDEBUG_SESSION_START is set to. PHPSTORM is just a placeholder here because all connections are going to the same place.)
  3. PHPStorm should pop up and let you start debugging.

Troubleshooting

Check these things:

  • Make sure that on the server you can use telnet to connect to port 9000 when PHPStorm is listening, and not when it's not.
  • Make sure you have a breakpoint set and PHPStorm is listening.
  • Make sure Xdebug is configured by visiting phpinfo any way you want to.

Resources

  • The Xdebug site, xdebug.org, is easy, once you understand what's going on and why. It has full configuration instructions. Send a little (or big) donation while you're there. Derick Rethans has been maintaining Xdebug faithfully for years and years.
  • PHPStorm is available for a demo download and there are many instructions and blog posts on "Zero-configuration debugging", which essentially means that PHPStorm will listen for an accept anything, as I've demonstrated here.
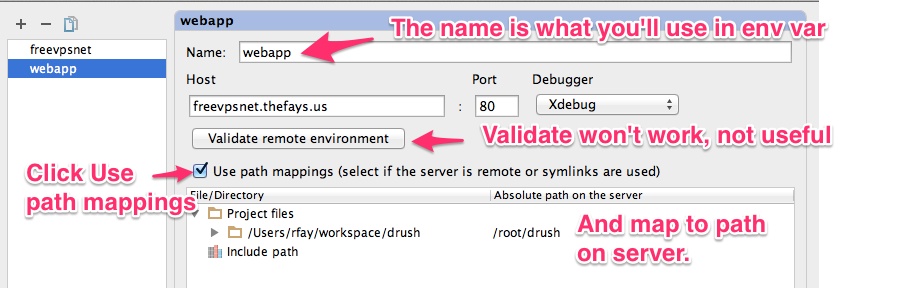
  • You can also debug command-line php activity on a remote server using nearly the same technique. See my related article on remote command-line debugging. It basically involves doing what we've done here and setting the environment variables XDEBUG_CONFIG="idekey=PHPSTORM" and PHP_IDE_CONFIG="serverName=yourservername", where yourservername is the name of a PHPStorm "server" you've set up to map remote to local paths for your project.
  • More than one person can debug on a remote server at the same time, but it requires a dbgp proxy to be running on the remote server which will accept connections and connect to the correct local workstation based on the IDEKEY. Configuring PhpStorm, XDebug, and DBGp Proxy Settings for Remote Debugging with Multiple Users explains this quite nicely and explains where to obtain a proxy (pydbgpproxy) that will do the work required.

Remote Command-Line debugging with PHPStorm for PHP/Drupal (including drush)

Introduction

XDebug with PHPStorm can do step-debugging on remote sessions started from the command line on a remote machine. You just have to set up a couple of environment variables, map the remote code to the local code that PHPStorm has at its disposal, and tunnel the xdebug connection to your workstation.

Note: If you just want to debug a PHP script (or drush command) on the local machine, that's much easier. Just enter PHPStorm's Run/Debug configuration and create a new "PHP Script" configuration.

Overview of Setup

  • We'll create a PHPStorm project that contains all the code we want to debug on the remote machine. This can be done via source control with matching code, by mounting the remote directory to your local machine, or any way you want.
  • Create a mapping from server side directories to PHPStorm-side code (A "Server" configuration in PHPStorm)
  • Use environment variables on the remote machine to tell xdebug what to do with the debugging session
  • Tunnel the Xdebug TCP connection if necessary.
  • Make PHPStorm listen for a connection
  • Create a breakpoint somewhere early in the execution path
  • Run the command-line tool on the remote server.

Step-by-Step

  1. On the remote server install xdebug and set xdebug.remote_enable=1 In your xdebug.ini (or php.ini). For complete details see Remote Drupal/PHP Debugging with Xdebug and PHPStorm.
  2. Open your project/directory in PHPStorm; it must have exactly the same code as is deployed on the remote server. (You can optionally mount the remote source locally and open it in PHPStorm using sshfs or any other technique you want, see notes below.)
  3. If you're debugging drush, you probably need to copy it into your project (you don't have to add it to source control). PHPStorm is quite insistent that executing code must be found in the project.
  4. Create a debug configuration and a "Server" configuration in your project. The Server configuration is used to map code locations from the server to your PHPStorm code. Run->Edit Configurations, Create PHP Web App, Create a server, give the server a name. Click "Use path mappings" and configure the mappings from your project to the remote server's code. (See PHPstorm server configuration)
  5. If your remote server cannot directly create a tcp connection to your workstation, you'll have to tunnel port 9000 to your local machine. ssh -R 9000:localhost:9000 your_account@remote_server.example.com - For more details and debugging, see
  6. Click the "Listen for PHP Debug Connections" button in PHPStorm. I call this the "unconditional listen" button, because it makes PHPStorm listen on port 9000 and accept any incoming connection, no matter what the IDE key. See Remote Drupal/PHP Debugging with Xdebug and PHPStorm
  7. In PHPStorm, set a breakpoint somewhere that your PHP script is guaranteed to hit early in its execution. For example, if you're debugging most drush actions, you could put a breakpoint on the first line of drupal_bootstrap() in includes/bootstrap.inc.
  8. If the computer is not reachable from the server, you will need to tunnel the connection from the server to your workstation. ssh -R 9000:localhost:9000 some_user_account@www.example.com For more details and debugging, Remote Drupal/PHP Debugging with Xdebug and PHPStorm
  9. In your command-line shell session on the remote server set the environment variable XDEBUG_CONFIG. For example, export XDEBUG_CONFIG="idekey=PHPSTORM remote_host=172.16.1.1 remote_port=9000" (Note that port 9000 is the default both for xdebug and for PHPStorm.) If you're tunneling the connection then remote_host must be 127.0.0.1. If you're not tunneling, it must be the reachable IP address of the machine where PHPStorm is listening.
  10. export PHP_IDE_CONFIG="serverName=yourservername" - the serverName is the name of the "server" you configured in PHPStorm above, which does the mapping of remote to local paths.
  11. On the command line run the command you want to run. For example drush cc all or php /root/drush/drush.php status
  12. If all goes well you'll stop at the breakpoint. You can step-debug to your heart's content and see variables, etc.

Drush+Drupal-Specific Hints

  • I've had the best luck actually copying drush into my codebase so that its mappings and Drupal's mappings can be in the same directory.
  • Once you have the environment variables set you can either use the "drush" command (which must be in your path) or use "php /path/to/drush/drush.php" with your drush options. Make sure you're using the drush that's mapped as a part of your project.

Notes and resources

  • We set the xdebug.remote_host in the XDEBUG_CONFIG environment variable; it could also have been configured in the xdebug.ini as xdebug.remote_host=myworkstation.example.com. (Note that the default is "localhost", so if you're tunneling the connection you don't actually have to set it.)
  • Full details about remote debugging on xdebug.org
  • Debugging: Make sure that only PHPStorm is listening on port 9000. If something else (most notoriously php-fpm) is listening there, you'll have to sort it out. PHPStorm is happy to listen on another port, see the preferences, and you'll need to change your environment variable to something like export XDEBUG_CONFIG="idekey=PHPSTORM remote_host=172.16.1.1 remote_port=9999
  • You may want to use sshfs or some other technique to mount the remote code to your local machine. sshfs your_account@server.example.com:~/drush /tmp/drush would mount the contents of drush in the remote home directory to /tmp/drush (which must already exist) on your local machine. It must be writeable for PHPStorm to work with it as a project, so you'll have to work that out.
  • The article that taught me everything I know about this is Command-line xdebug on a remote server. Thanks!
Subscribe to debugging