Summary: This post provides a way to develop/debug in a web environment where you don't have control of the calling party and your environment must be available on the global internet.
It can be difficult to debug/develop a handler for an incoming web service when you don't have control of the caller. For example, I was developing a handler for Mandrill's inbound webhooks, where Mandrill calls your site when an email comes in. So in this case
- The receiving website must be accessible on the internet so that Mandrill can call it.
- Mandrill alone is hitting the site. I could debug with an imitation POST, but then that wouldn't be the real thing would it?
There are a couple of ways to approach this:
- Set up a full debugging environment on an internet-connected host (For example, set up a full dev environment possibly with GUI and PHPStorm for example, on an internet host. This is easy enough to do but kind of ugly.
- Debug with the application on the server but your debugger local using dbgp. This is do-able and an alternate approach to what's described here. It's a bit more awkward, but great for when the issues or problems can't be recreated on your local machine. It probably also requires most of the strategies shown here, but tunneling the debugger connection instead of tunneling the actual HTTP request.
- Use printf-style debugging, outputting logs of everything that happens. This works, but you have little control and it's really ugly and you don't have enough info about what's going on.
A nicer way with a full local debugger
I use the wonderful PHPStorm IDE with debugger (which they provide free to open-source projects like Drupal and Warmshowers.org!), but this technique should work for any IDE. You do have to already know how to set up your system for debugging.
What you need:
- A host on the internet. Any machine which is reachable directly on the internet. My instructions will explain how to do it with a linux machine. This really can be any machine, it's going to be used only to proxy a port to your local machine. You could even use a production machine without doing any damage. You do have to have control of the sshd configuration (/etc/ssh/sshd_config or equivalent). And you have to make sure that no firewall is blocking the port you choose to use (my example uses port 8888.)
- Your local IDE/project set up for debugging with Xdebug. (I'm sure you can do this with any other IDE and with Zend Debugger as well, but I will only show for PHPStorm and xdebug.)
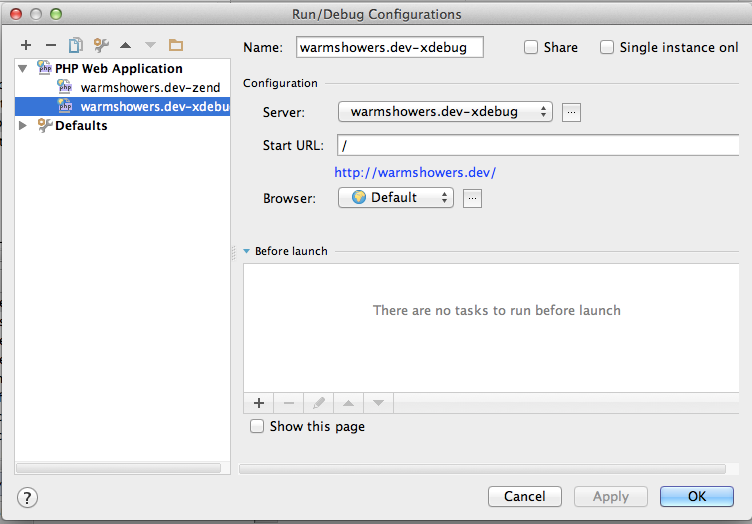
- Make sure you can do step-debugging on your local machine. Use the classic technique where you create a debug configuration for your project rather than the new PHPStorm "Listen" button. (I imagine there's a way to do this with the listen button.) Test this by setting a breakpoint and running your project and making sure it stops on the breakpoint. If you don't already know how to do step-debugging, this would be a good time to learn. It's a critical skill for any developer. Resources: (PHPStorm instructions, Drupal.org article, PHPStorm debugging article) (Images of my PHPStorm web application configuration are below.)
- On your internet-connected machine, configure sshd to set "GatewayPorts yes". (The default is "no"). This is configured in /etc/ssh/sshd_config on both DebianUbuntu and RHEL/CentOS distributions.). After changing the configuration, restart sshd with "sudo service ssh restart"
- Use ssh to create a tunnel which will bring a port on your internet-available machine to your local machine:
ssh -R :8888:localhost:80 example.comwill bring traffic on port 8888 of the internet-connected "example.com" to port 80 on localhost (where your debugging environment is). Essentially, once you've done this, all traffic hitting http://example.com:8888 will actually land on your local machine on port 80. (This won't work if you're blocking port 8888 on the firewall of your internet-connected host, of course.) - Try accessing your internet-connected machine with a browser to demonstrate that traffic is routed through. With my example, you would now be able to hit http://example.com:8888 and the dev site on you local machine would appear (slowly, perhaps). If you don't have access to your local dev site now using this technique, you aren't ready to continue.
- Test debugging by accessing your external site. Start debugging on PHPStorm using the configuration you created earlier. The console will show "Waiting for incoming connection with ide key '15247'". Your IDE key will be different of course. With a breakpoint set, visit your external internet-connected URL like this: htttp://example.com:8888?XDEBUG_SESSION_START=15247- you should see your IDE take control and stop at your breakpoint.
- Now configure the external service with the URL it is to hit when some event happens AND with the XDEBUG_SESSION_START query string. I was working with the Mandrill Incoming project, so my inbound URL looked like this: http://example.com:8888/services/rest/mandrill_events?XDEBUG_SESSION_START=15247
- Whatever you have to do to cause an event to happen, make it happen. In my case, this meant sending an email via Mandrill which was to be delivered to my web service.
- Voila, your debugger opens and lets you step through the web service call.
PHPStorm Server Configuration

PHPStorm Web Application Configuration

PHPStorm "Waiting for connection"
