Submitted by rfay on
Introduction
XDebug with PHPStorm can do step-debugging on remote sessions started from the command line on a remote machine. You just have to set up a couple of environment variables, map the remote code to the local code that PHPStorm has at its disposal, and tunnel the xdebug connection to your workstation.
Note: If you just want to debug a PHP script (or drush command) on the local machine, that's much easier. Just enter PHPStorm's Run/Debug configuration and create a new "PHP Script" configuration.
Overview of Setup
- We'll create a PHPStorm project that contains all the code we want to debug on the remote machine. This can be done via source control with matching code, by mounting the remote directory to your local machine, or any way you want.
- Create a mapping from server side directories to PHPStorm-side code (A "Server" configuration in PHPStorm)
- Use environment variables on the remote machine to tell xdebug what to do with the debugging session
- Tunnel the Xdebug TCP connection if necessary.
- Make PHPStorm listen for a connection
- Create a breakpoint somewhere early in the execution path
- Run the command-line tool on the remote server.
Step-by-Step
- On the remote server install xdebug and set xdebug.remote_enable=1 In your xdebug.ini (or php.ini). For complete details see Remote Drupal/PHP Debugging with Xdebug and PHPStorm.
- Open your project/directory in PHPStorm; it must have exactly the same code as is deployed on the remote server. (You can optionally mount the remote source locally and open it in PHPStorm using sshfs or any other technique you want, see notes below.)
- If you're debugging drush, you probably need to copy it into your project (you don't have to add it to source control). PHPStorm is quite insistent that executing code must be found in the project.
- Create a debug configuration and a "Server" configuration in your project. The Server configuration is used to map code locations from the server to your PHPStorm code. Run->Edit Configurations, Create PHP Web App, Create a server, give the server a name. Click "Use path mappings" and configure the mappings from your project to the remote server's code. (See
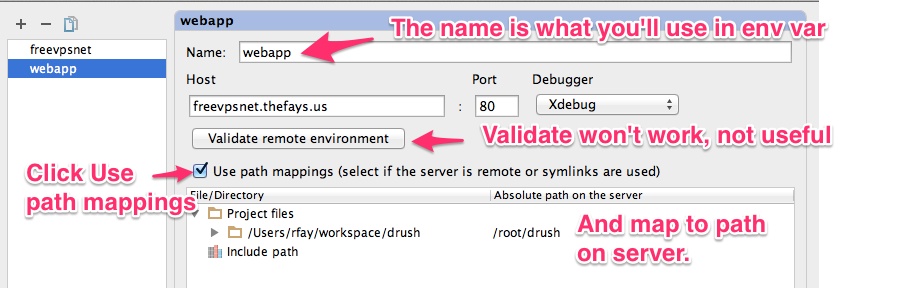 )
) - If your remote server cannot directly create a tcp connection to your workstation, you'll have to tunnel port 9000 to your local machine.
ssh -R 9000:localhost:9000 your_account@remote_server.example.com- For more details and debugging, see - Click the "Listen for PHP Debug Connections" button in PHPStorm. I call this the "unconditional listen" button, because it makes PHPStorm listen on port 9000 and accept any incoming connection, no matter what the IDE key. See Remote Drupal/PHP Debugging with Xdebug and PHPStorm
- In PHPStorm, set a breakpoint somewhere that your PHP script is guaranteed to hit early in its execution. For example, if you're debugging most drush actions, you could put a breakpoint on the first line of drupal_bootstrap() in includes/bootstrap.inc.
- If the computer is not reachable from the server, you will need to tunnel the connection from the server to your workstation.
ssh -R 9000:localhost:9000 some_user_account@www.example.comFor more details and debugging, Remote Drupal/PHP Debugging with Xdebug and PHPStorm - In your command-line shell session on the remote server set the environment variable XDEBUG_CONFIG. For example,
export XDEBUG_CONFIG="idekey=PHPSTORM remote_host=172.16.1.1 remote_port=9000"(Note that port 9000 is the default both for xdebug and for PHPStorm.) If you're tunneling the connection then remote_host must be 127.0.0.1. If you're not tunneling, it must be the reachable IP address of the machine where PHPStorm is listening. export PHP_IDE_CONFIG="serverName=yourservername"- the serverName is the name of the "server" you configured in PHPStorm above, which does the mapping of remote to local paths.- On the command line run the command you want to run. For example
drush cc allorphp /root/drush/drush.php status - If all goes well you'll stop at the breakpoint. You can step-debug to your heart's content and see variables, etc.
Drush+Drupal-Specific Hints
- I've had the best luck actually copying drush into my codebase so that its mappings and Drupal's mappings can be in the same directory.
- Once you have the environment variables set you can either use the "drush" command (which must be in your path) or use "php /path/to/drush/drush.php" with your drush options. Make sure you're using the drush that's mapped as a part of your project.
Notes and resources
- We set the xdebug.remote_host in the XDEBUG_CONFIG environment variable; it could also have been configured in the xdebug.ini as
xdebug.remote_host=myworkstation.example.com. (Note that the default is "localhost", so if you're tunneling the connection you don't actually have to set it.) - Full details about remote debugging on xdebug.org
- Debugging: Make sure that only PHPStorm is listening on port 9000. If something else (most notoriously php-fpm) is listening there, you'll have to sort it out. PHPStorm is happy to listen on another port, see the preferences, and you'll need to change your environment variable to something like
export XDEBUG_CONFIG="idekey=PHPSTORM remote_host=172.16.1.1 remote_port=9999 - You may want to use sshfs or some other technique to mount the remote code to your local machine.
sshfs your_account@server.example.com:~/drush /tmp/drushwould mount the contents of drush in the remote home directory to /tmp/drush (which must already exist) on your local machine. It must be writeable for PHPStorm to work with it as a project, so you'll have to work that out. - The article that taught me everything I know about this is Command-line xdebug on a remote server. Thanks!
10 Comments
Great write-up!
Submitted by Rik de Boer on
Knew this was possible and have always wanted to do it, but never got round to doing the research.
Thanks so much for getting to the bottom and sharing, Randy!
Rik
Working for drush test-run?
Submitted by Joachim on
Hi Randy,
Thank for the comprehenive post! Did you succeed to get it running for "drush test-run"? For me, breakpoints within drush are working, but breakpoints in the test classes have no effect.
Cheers, Joachim
You need more for Drupal testing
Submitted by rfay on
So for Drupal testing, you may want a little bit more.
?XDEBUG_START_SESSION=PHPSTORMto the end of the URL. https://drupal.org/node/2152077 has info on this, slanted toward testbot debugging, but it's the same class of problem.admin/config/development/testing?XDEBUG_START_SESSION=PHPSTORM(or just use PHPStorm's start-debugging controls) and set breakpoints in the tests.run-tests.sh to the rescue
Submitted by Joachim on
Well, it worked with scripts/run-tests.sh (camouflaged php script). My full command-line for it was
XDEBUG_CONFIG="idekey=PHPSTORM" php scripts/run-tests.sh --url 'http://myhost/mypath/?XDEBUG_START_SESSION=PHPSTORM' --verbose --color --class MyTestCaseStill no luck with drush test-run, nor with the web UI (perhaps the query string gets lost when clicking "Run tests"?). Yet, being able to debug from the command line with run-tests.sh helps already a lot. Thanks!
Glad to hear something works!
Submitted by rfay on
Glad to hear something's working for you.
I've had good luck before with the web UI, so don't know what happened there. But it's been a while. The magic is unwinding how many different web sessions there are. And run_tests.sh is the one place where we seem to have some control of it.
You also might consider experimenting with xdebug.remote_autostart (see http://xdebug.org/docs/remote), which just might do the job. Please do let us all know if that works.
autostart and debug cookies are also options
Submitted by Joachim on
xdebug.remote_autostart worked for me - thanks! This, as a last resort, should work in any case.
Another option I found working is setting a XDEBUG_SESSION cookie. With a bookmarklet provided by JetBrains (http://www.jetbrains.com/phpstorm/marklets/) the debugging cookie can conveniently be switched on and off in the browser.
One additional thing is worth mentioning: By default, phpstorm is configured for only one debug connection. This may cause mysterious hangs when used with simpletest, which opens multiple web sessions. The setting can be changed in Settings > PHP > Debug > Xdebug > Max. simultanous connections.
Fantastic!
Submitted by rfay on
Glad that worked.
And thanks for the info about one debug connection - I've been baffled by that before. That will help enormously.
Saved!
Submitted by McFateM on
Found and tried six other blog posts explaining remote debugging in PHPStorm for Drush before this one. None of the others worked...this one works perfectly. Many thanks!
PHPStorm 10 + Drupal 7.41 + Drush 8 + Vagrant
Submitted by Dan on
Anyone try this with PHPStorm 10 + Drupal 7.41 + Drush 8 + Vagrant ?? I'm having no luck. Jetbrains has re-orged the settings & configurations again.
Max. Simultaneous Connections >= 2
Submitted by Elijah Lynn on
Recently came across an issue where xdebug on the CLI stopped working. Eventually after enough tinkering I found that the maximum simultaneous connections needs to be set to 2 or higher. Turns out one of the later versions of Drush (probably my upgrade to Drush 8) uses a subcommand which creates another connection. See https://github.com/drush-ops/drush/issues/1534